Analytics
The analytics page is your workspace-wide data view across your whole roster. Coach → Analytics opens it.
It covers aggregate metrics across all your clients: overview, progress reports, and activity trends. For one client’s numbers — including attention signals and wins — open their Analytics tab on the client detail page.
Timeframe
Pick a timeframe at the top — 7 days, 30 days, or 90 days. Every metric on the page recomputes against that window.
Workspace overview tabs
The overview view has three tabs:
| Tab | What it shows |
|---|---|
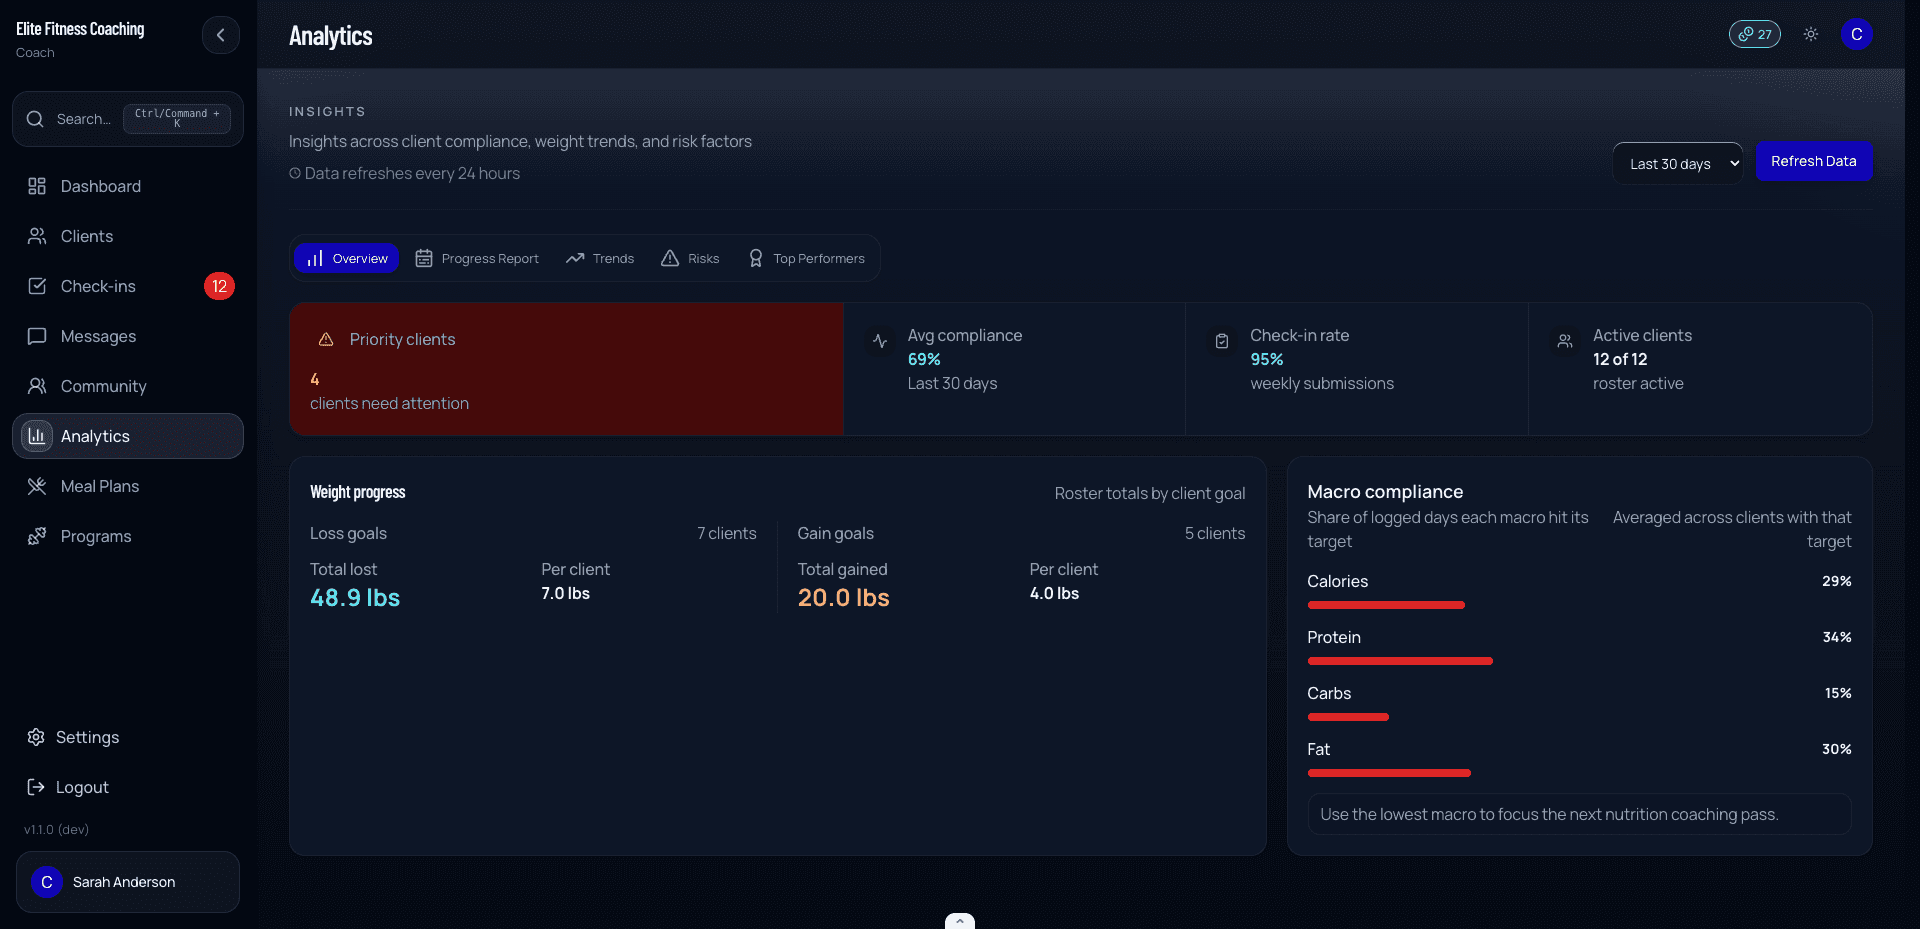
| Overview | Active clients, average Plan Adherence across scored clients, recent submission rate, weight outcomes, and nutrition-specific macro alignment |
| Progress Report | An activity rollup (weekly, biweekly, or monthly) with days active, Plan Adherence, coach focus, workouts, meals, steps, macros, cardio, weight lifted, and goal-directed weight change |
| Trends | A forward-only Plan Adherence baseline from server-calculated check-in snapshots, plus week-over-week active clients and check-ins submitted |
The Plan Adherence trend starts with check-ins saved under the current scoring version. Older or unversioned scores are not backfilled, and weeks without a trusted snapshot stay as gaps. The chart also shows how many workspace clients contributed a scored snapshot so you can judge the average in context.
Progress report
The Progress Report tab rolls up roster activity over a rolling window and compares it with the equal-length window immediately before it. Pick the cadence with the Weekly / Biweekly / Monthly toggle (7, 14, or 30 days), and use the arrow controls to step back and forth through periods. Days-active counts and assigned opportunities use the window length you choose.
The top of the report rolls up:
- Total weight lifted
- Workouts and meals logged
- Total steps
- Days with macro logging
- Cardio minutes
- Active clients and average Plan Adherence change
- Weight lost by weight-loss clients and weight gained by muscle-gain clients
The client activity table shows who logged, how many days they were active, their assignment-aware Plan Adherence, score confidence, and the assigned area that needs the most coaching attention. Only work that was assigned and due can lower Plan Adherence. A client with no applicable assigned work is shown as Not scored, not 0%. Team coaches see their assigned clients. Admin coaches see the active workspace roster. Coach focus distinguishes logging from target attainment, such as days with steps logged versus days where the assigned step target was met.
Select Share Story to create a story-sized image for social media. The image contains aggregate workspace totals and coach branding only. Client names and client-level details are never included. Plan Adherence is private coach context and is not included in the story image.
When a new analytics feature includes a walkthrough, a New in Analytics card appears on the coach dashboard. Select Show me to open the feature and follow the on-screen steps. You can dismiss the card with the close button; it will not return unless the walkthrough is updated.
Per-client analytics
Per-client analytics now live on the client detail page rather than here. Open a client and switch to their Analytics tab for Plan Adherence, confidence, component-level assigned/due evidence, Data Coverage, Attention, Wins, and separate weight and steps outcomes over a 4 / 8 / 12-week window. Nutrition shows complete-day target alignment or structured meal completion instead of a generic macro-compliance average. Their day-to-day activity is on the Logs tab, and their training history is on the Workouts tab.
This analytics page stays focused on workspace-wide numeric trends; the client detail page is the per-client, log-review surface.
Attention and wins
Workspace-level Attention and Wins lists used to live on separate Analytics tabs. That detail now lives on each client’s Analytics tab (and roster status buckets), so this page stays focused on workspace aggregates. See Clients → opening a client.
Wellness analytics
Wellness data (sleep, soreness, stress, energy) shows up in dedicated cards on a client’s Analytics tab (on the client detail page) when there’s enough data:
- Wellness key insights — summary findings
- Wellness key correlations — how wellness metrics correlate with weight or training
- Wellness focus days — days that consistently score lowest (e.g. Sunday energy crashes)
- Wellness optimal ranges — ranges where the client performs best
- Wellness recommendations — actionable suggestions
- Wellness risk factors — flags worth investigating
When data is too thin to draw conclusions, an Insufficient Data state shows instead — usually for clients in their first few weeks.
Going deeper
For the workflows that actually drive most of your decisions — when to adjust macros, when to deload, how to read compliance — see the Coaching Playbook.